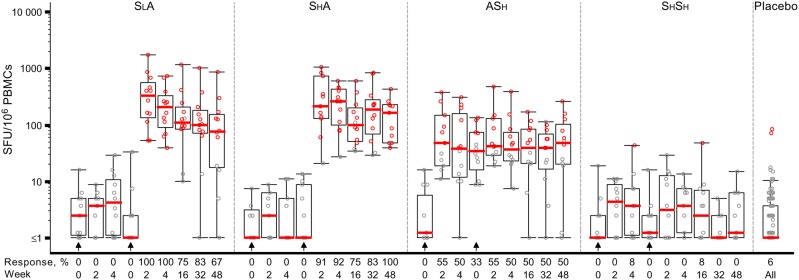
Figure 1.
Administration of a Sendai virus (SeV)–vectored vaccine encoding human immunodeficiency virus 1 (HIV-1) Gag (SeV-Gag) primes Gag-specific T-cell responses detected by interferon γ enzyme-linked immunospot analysis. The y-axis shows spot-forming units (SFU)/106 peripheral blood mononuclear cells (PBMCs) on a log scale. All responses reflect subtraction of background spots. Black circles denote response below the cutoff, defined in the Materials and Methods, to the Gag peptide pool; red circles denote response above the cutoff to the Gag peptide pool. The overlaid box plots summarize the responses (ie, median value, the 1st and 3rd quartiles, and the 5th and 95th percentiles). Red bars represent median values. The placebo responses are combined for all groups. The prime-boost regimens as follows: priming with a lower-dose SeV-Gag given intranasally, followed by boosting with an adenovirus 35–vectored vaccine encoding HIV-1 Gag, reverse transcriptase, integrase, and Nef (Ad35-GRIN) given intramuscularly (SLA); priming with a higher-dose SeV-Gag given intranasally, followed by boosting with Ad35-GRIN given intramuscularly (SHA); priming with Ad35-GRIN given intramuscularly, followed by boosting with a higher-dose SeV-Gag given intranasally (ASH); and priming and boosting with a higher-dose SeV-Gag given intranasally (SHSH). Arrows show the timing of vaccinations in each group. In the x-axis, weeks represent the time after the most recent vaccination, to facilitate cross-regimen comparisons.

