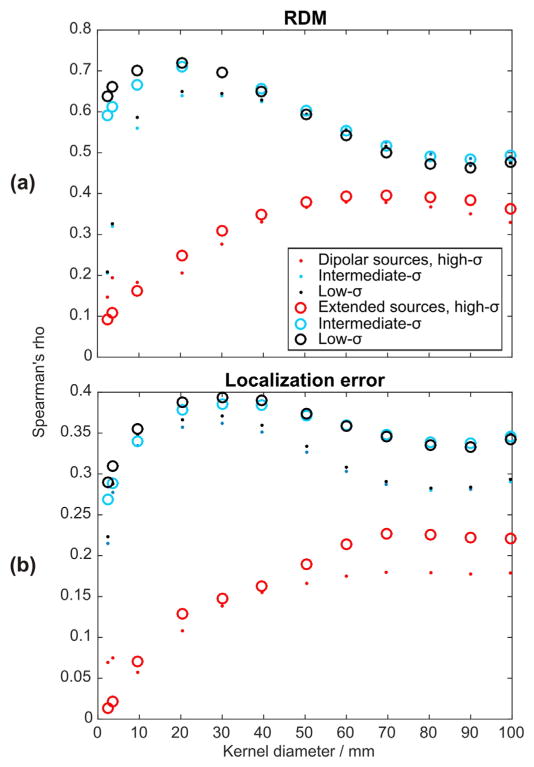
Fig. 9.
Rank correlation between error measures and blood vessel density at multiple spatial scales. The diameter of the spherical kernels used to determine the local blood vessel density was varied between 0 and 100 mm. Note the calculation of local blood vessel density included vessels of all sizes; thus high values may indicate both, the presence of large vessels, or local clusters of many small vessels. (a) Results for forward errors, and (b) inverse errors.

