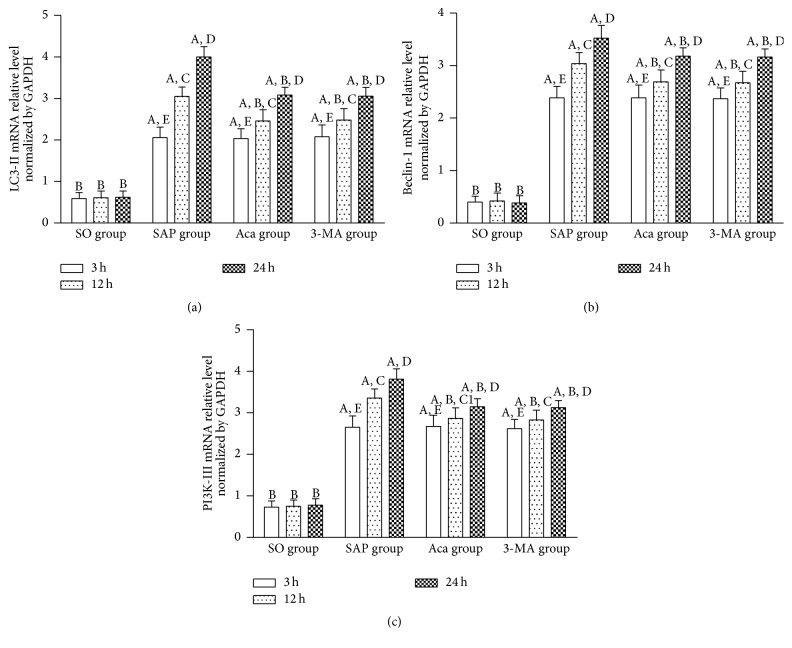
Figure 4.
The mRNA levels of LC3-II (a), Beclin-1 (b), and PI3K-III (c) in the pancreas tissue at 3, 12, and 24 h in four groups. A P < 0.01 versus SO group at the same time point; B P < 0.01 versus SAP group at the same time point; 12 h versus 3 h in the same group, C P < 0.01, C1 P < 0.05; 24 h versus 12 h in the same group, D P < 0.01; 24 h versus 3 h in the same group, E P < 0.01.

