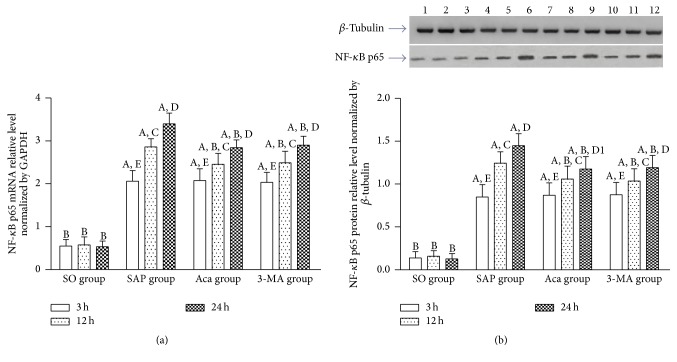
Figure 6.
The expression of nucleus NF-κB p65 mRNA (a) and protein (b) levels in the pancreas tissue at 3, 12, and 24 h in four groups. A P < 0.01 versus SO group at the same time point; B P < 0.01 versus SAP group at the same time point; 12 h versus 3 h in the same group, C P < 0.01; 24 h versus 12 h in the same group, D P < 0.01; D1 P < 0.05; 24 h versus 3 h in the same group, E P < 0.01. 1: SO-3 h; 2: SO-12 h; 3: SO-24 h; 4: SAP-3 h; 5: SAP-12 h; 6: SAP-24 h; 7: Aca-3 h; 8: Aca-12 h; 9: Aca-24 h; 10: 3-MA-3 h; 11: 3-MA-12 h; 12: 3-MA-24 h.

