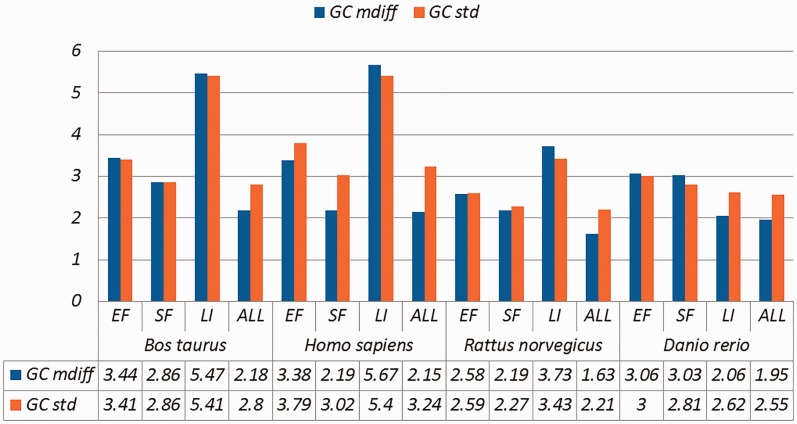
Figure 3.
A selection of results for organisms in terms of GC content (Exemplar vs. Duplicate pairs) Categories are the same as Table 1; mdiff and std: the mean and standard deviation of absolute value of the difference between each exemplar and the mean of the duplicates group, respectively.

