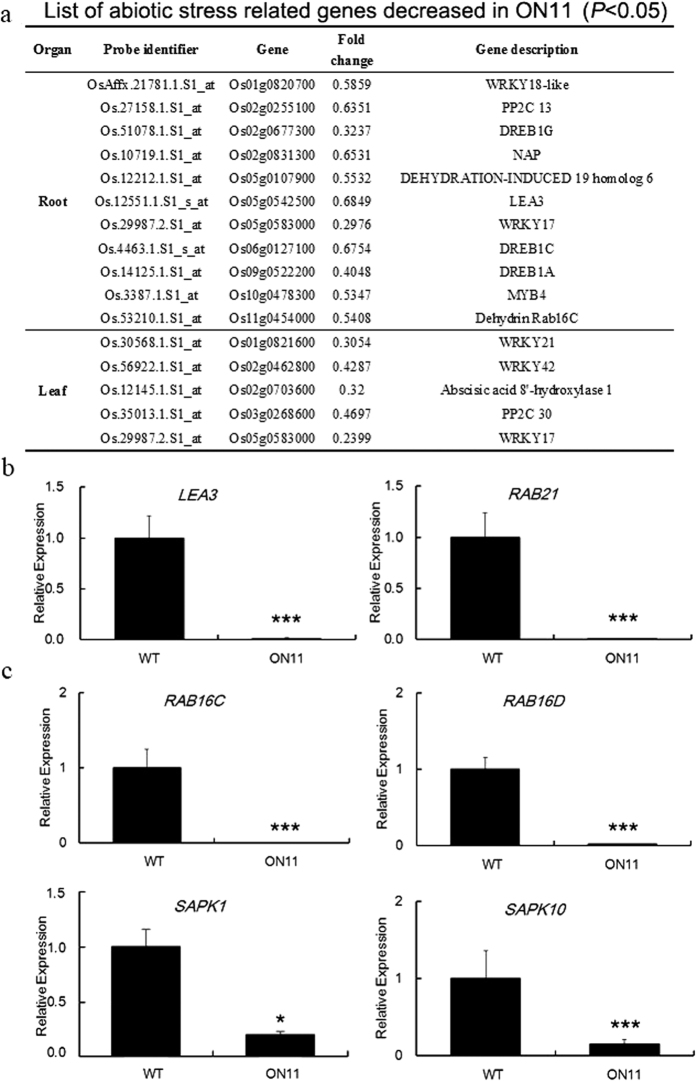
Figure 7. Microarray analysis and real time PCR confirmation of abiotic stress related genes.
(a) List of abiotic stress related genes which decreased in ON11. (b,c) Expression of stress related genes in leaf and root respectively. Data were means ± SE with at least three biological replicates. Asterisks represent statistically significant differences between WT and transgenic plants. *P < 0.05, **P < 0.01, ***P < 0.001.

