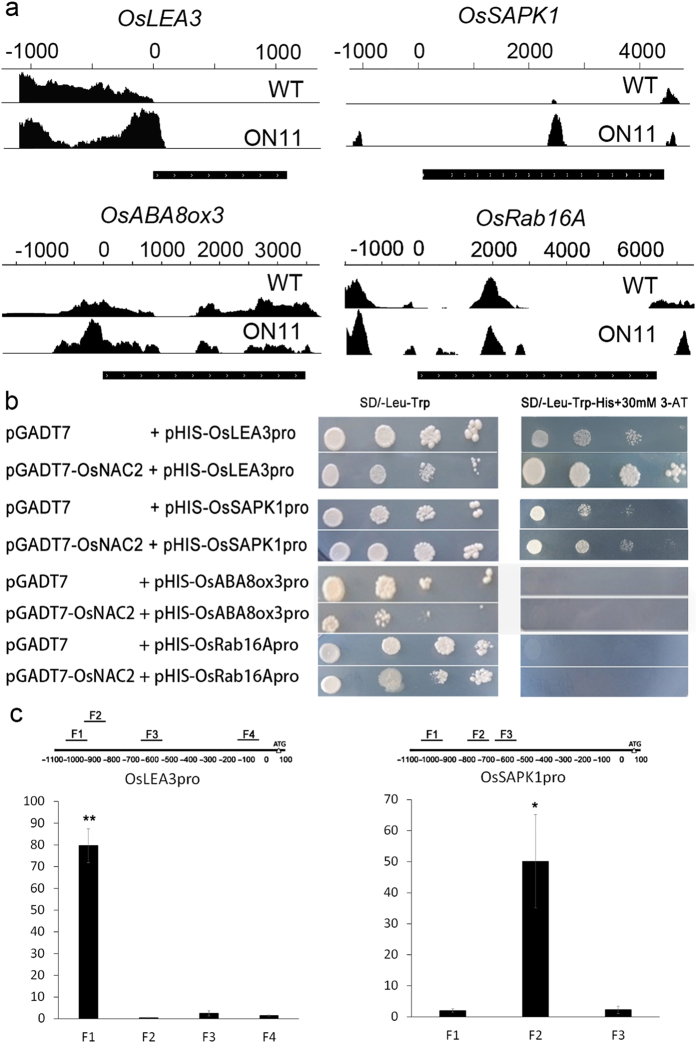
Figure 9. OsLEA3 and OsSAPK1 are the direct target genes of OsNAC2.
(a) Binding peaks of OsLEA3, OsSAPK1, OsABA8ox3 and OsRab16A in ChIP-seq assay. Black peaks represent for sequence hits on DNA of each gene regions. Higher the peak is, more binding in this region. The bars above the peak show the distance from ATG start codon of each gene. The black bar under the peak represents for the coding area of each gene, arrows on the bar show the coding direction of the gene. (b) Yeast one-hybrid assays showed that OsNAC2 Only binded to the promoter of OsLEA3 and OsSAPK1. (c) ChIP-PCR assays. Total protein extracts from 35 S:OsNAC2–mGFP transgenic plants grown on MS-agar for 2 weeks were immunoprecipitated with an anti-GFP antibody. Fragmented genomic DNA was eluted from the protein–DNA complexes and subjected to qPCR analysis. The long black bars represent for promoter region which we designed primers for. The numbers under the bar show the distance from ATG start codon. Short bars represents for the corresponding region of each pair of primers on the promoter. Error bars are the standard error (SE) for three biological repeats, *P < 0.05, **P < 0.001.

