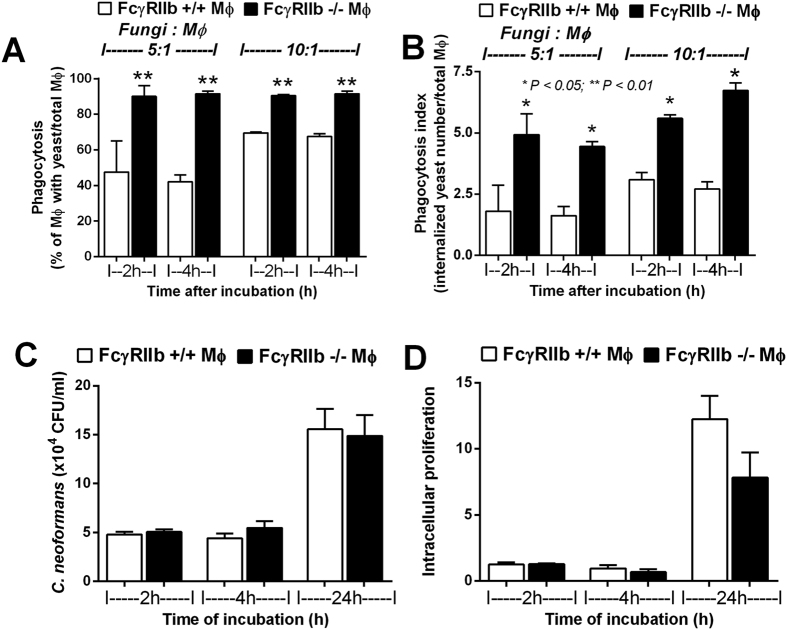
Figure 6.
Percentage of macrophages (MФ) demonstrating phagocytosis (A) and the average number of phagocytosed fungi per MФ (total number of phagocytosed fungi/total MФ) after incubation with C. neoformans at ratios of fungi: MФ of 5:1 and 10:1 (B) are shown. The total killing ability (extruded and intracellular yeast) (C) and intracellular proliferation (concerning only intracellular yeast; see methods) (D) of MФ determined by the number of C. neoformans colonies after incubation with MФ from wild-type and FcγRIIb−/− mice are shown. *p < 0.05, **p < 0.01 (experiments were performed in triplicate).

