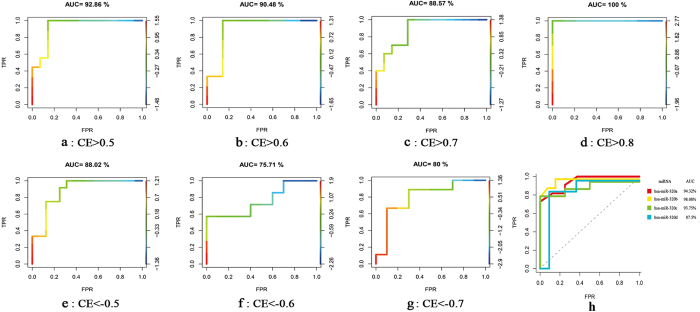
Figure 1. DEmiRs of late CP.
A RBF kernel-based SVM was designed and 5-fold cross-validation strategy was utilized to evaluate the performance of SVM classifier. The outcome of prediction was then assessed by ROC curve analysis. (a–g) The ROC curves of SVM classifier created on miRNA-miRNA pairs with diverse CE values. (a–d) The positive correlation miRNA-miRNA pairs; (e–g) The negative correlation miRNA-miRNA pairs; (h) The ROC curves of SVM classifier. It was created on 4 features: hsa-miR-320a, hsa-miR-320b, hsa-miR-320c and hsa-miR-320d. The diagonal line was the baseline (GEO CP, n = 38; GEO healthy control, n = 38).

