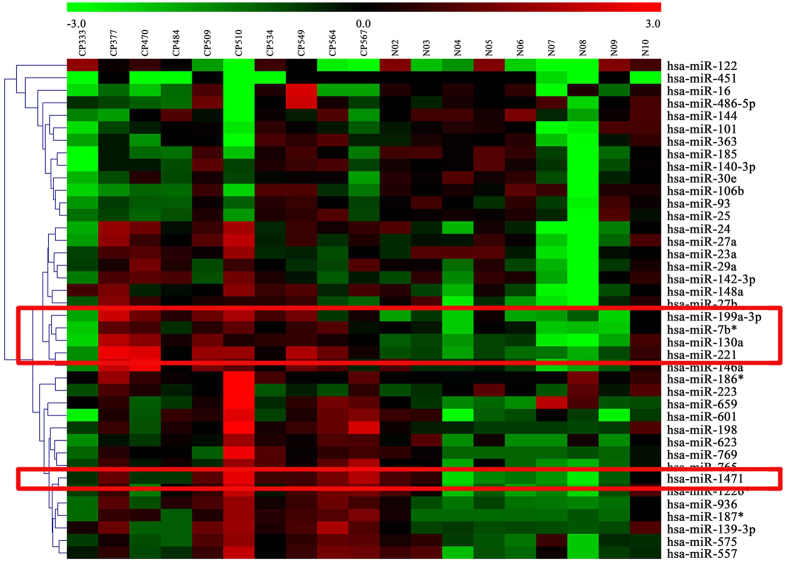
Figure 2. Clustering analysis of miRNA expression values for top 40 miRNAs of early CP.
The change of color from green to red represented the change in |logFC| from low to high (early CP, n = 10; healthy control, n = 9). FC was the fold change value. The DEmiRs were framed with red box. The miRNA expression profile was acquired using Agilent miRNA microarrays (G4450AA). The fluorescence intensity signal values were analyzed with software such as Agilent G4450AA Feature Extraction Software 9.5 and Agilent Scan Control Software version A. 7.0 etc.

