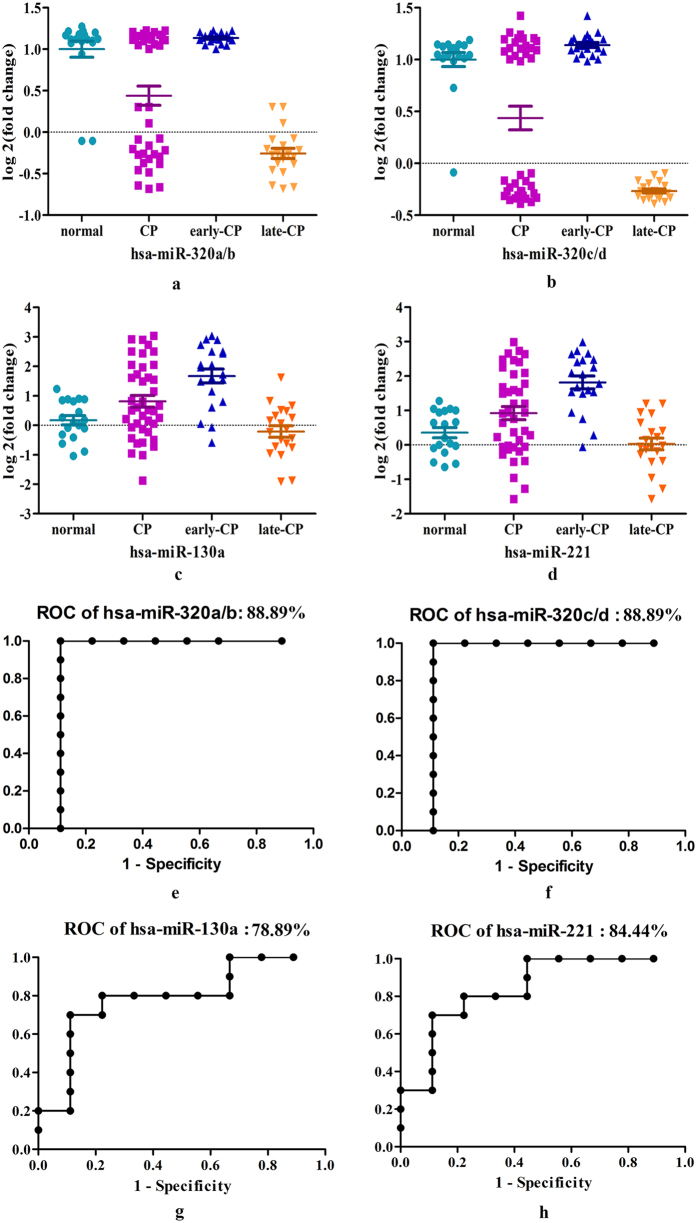
Figure 4. Validation of DEmiRs in a mixed group of patients from clinical practice.
Real-time PCR of the selected DEmiRs was performed and statistical significance was assessed with the use of Student’s t-test. (a,b) Validation of hsa-miR-320a-d by quantitative RT-PCR. The values of each miRNA were normalized; (c,d) Validation of hsa-miR-130a and hsa-miR-221 by quantitative RT-PCR. The values of each miRNA were normalized; (e–h) ROC curves of DEmiRs in predicting CP patients (early CP, n = 20; late CP, n = 20; healthy control, n = 18).

