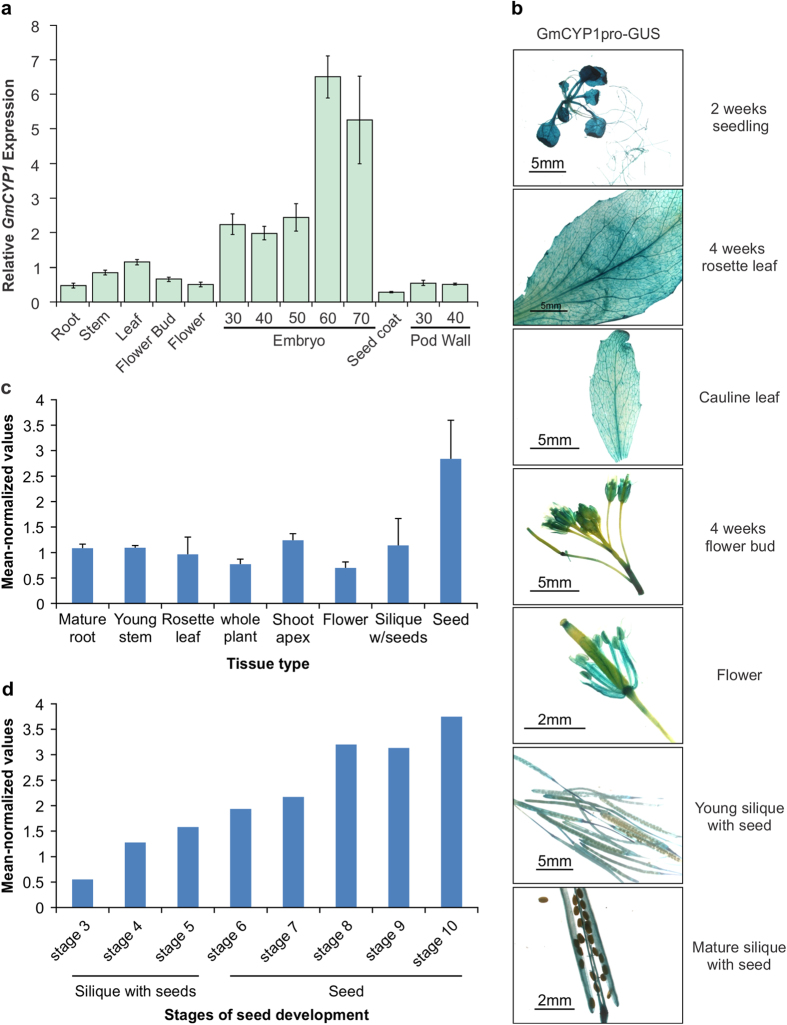
Figure 5. Expression analysis of GmCYP1 in soybean.
(a) Total RNA extracted from soybean root, stem, leaf, flower bud, flower, embryo (30, 40, 50, 60, and 70 days after pollination), seed coat and pod wall (30 and 40 days after pollination) were used for quantitative RT-PCR analysis of GmCYP1. Two biological replicates and three technical replicates for each biological replicate were carried out. The standard error of the mean is represented by an error bar. The data were normalized against SUBI-3 gene. (b) Histochemical analysis of GmCYP1promoter-GUS activity in vegetative and reproductive tissues during various stages of development in Arabidopsis. Construct containing a GmCYP1 promoter driven GUS gene was transformed into Arabidopsis and selected T2 transgenic plants were used for analysis. (c) The mean normalized expression values of ROC1 in different Arabidopsis tissues and (d) stages of seed development were obtained from AtGenExpress Visualization Tool (http://jsp.weigelworld.org/expviz/expviz.jsp). Error bars indicate the standard deviation of the mean. The stages of seed developments are: stage 3, mid globular to early heart embryos; stage 4, early to late heart embryos; stage 5, late heart to mid torpedo embryos; stage 6, mid to late torpedo embryos; stage 7, late torpedo to early walking-stick embryos; stage 8, walking-stick to early curled cotyledons embryos; stage 9, curled cotyledons to early green cotyledon embryos; and stage 10, green cotyledon embryos.

