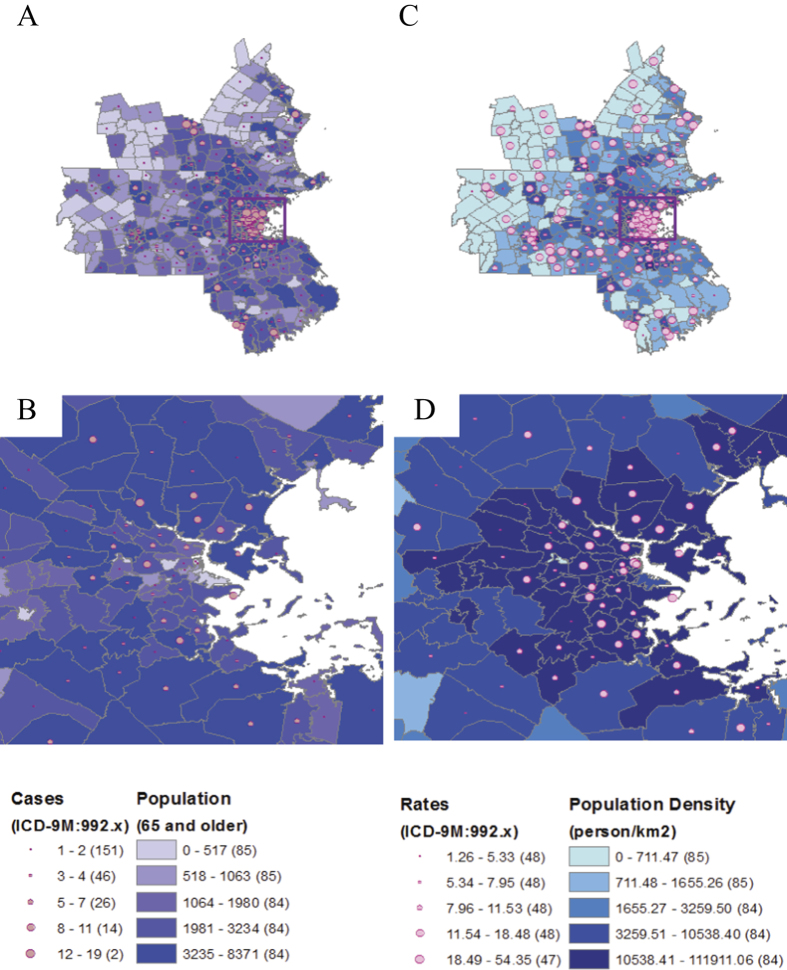
Figure 1.
The distributions of heat-related hospitalizations (HH), population of older adults aged 65 and over, or elderly (Panels (A) and (B), respectively), hospitalization rates (per 1 M people) and elderly population density (Panels (C) and (D), respectively), within the Boston MSA (Panels (A) and (C), respectively), and its the most urbanized part (Panels (B) and (D), respectively) observed in 1991–2006. Maps were created with ArcGIS 10.2. http://www.esri.com/software/arcgis/arcgis-for-desktop.

