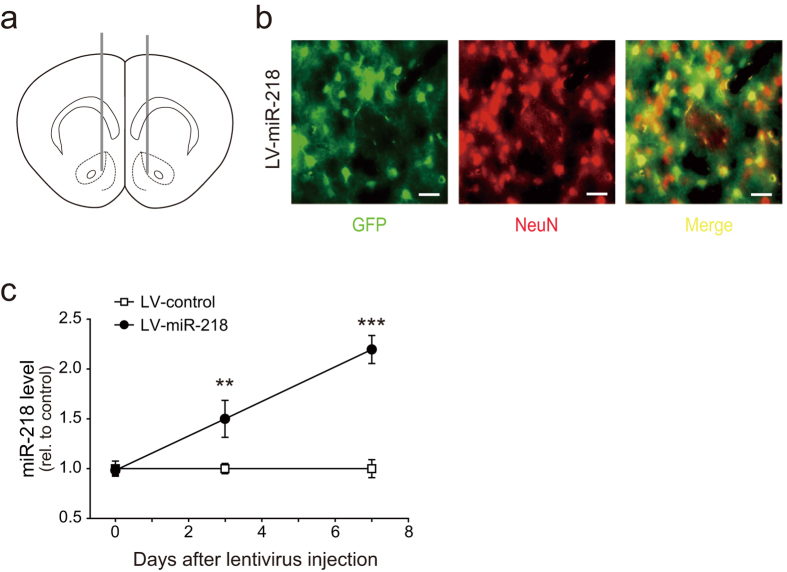
Figure 3. Lentiviral-mediated overexpression of miR-218 in NAc.
(a) Schematic representation of lentivirus injection sites. (b) Cell localization of LV-miR-218 infected cells (green), neurons using NeuN antibody (red), scale bar = 20 μm. (c) Relative miR-218 level in NAc with LV-control or LV-miR-218 injection on day 0, 3, 7. Enhanced expression level of miR-218 after LV-miR-218 injection in NAc in day 3 and day 7 (LV-control, n = 5, LV-miR-218, n = 5 on each day, **P < 0.01; ***P < 0.001). Data are shown as mean ± s.e.m.

