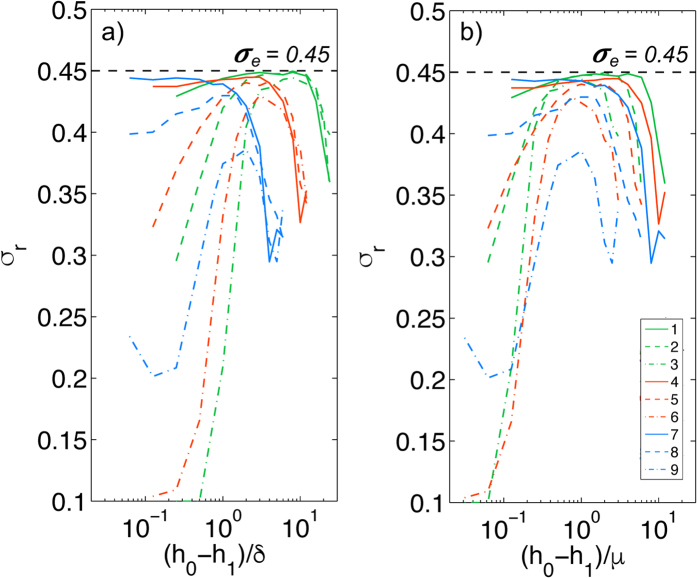
Figure 5. Recovered value σr of the Poisson’s ratio, obtained for σe = 0.45 and for different values of μ and δ, and plotted as a function of inter measurement plane distance h0 − h1.
The legend indicates the different cases considered. Case 1: μ/h0 = 0.02, δ/h0 = 0.01. Case 2: μ/h0 = 0.02, δ/h0 = 0.02. Case 3: μ/h0 = 0.02, δ/h0 = 0.04. Case 4: μ/h0 = 0.04, δ/h0 = 0.01. Case 5: μ/h0 = 0.04, δ/h0 = 0.02. Case 6: μ/h0 = 0.04, δ/h0 = 0.04. Case 7: μ/h0 = 0.08, δ/h0 = 0.01. Case 8: μ/h0 = 0.08, δ/h0 = 0.02. Case 9: μ/h0 = 0.08, δ/h0 = 0.04. (a) The inter measurement plane distance h0 − h1 is normalized with the length scale of the background noise (δ). (b) The inter measurement plane distance h0 − h1 is normalized with the length scale of the deformation field at the top plane (μ). The data were obtained for S2N = 1 and U0 = W0.

