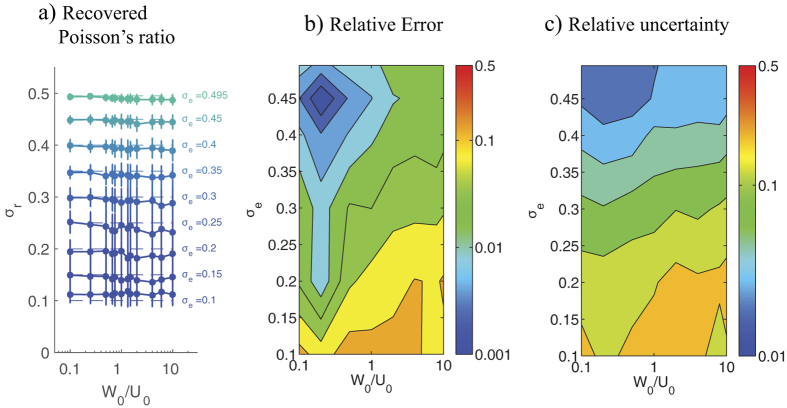
Figure 6. Accuracy and robustness of 2LETFM as a function of the ratio of normal to tangential deformation created by the cell on the substrate, W0/U0.
(a) Recovered value σr of the Poisson’s ratio, plotted as a function of W0/U0. The data are represented as mean ± standard deviation obtained from N = 100 random realizations. Each curve is obtained for a different value σe of the exact Poisson’s ratio that is being recovered by 2LETFM. This exact value is indicated with a dashed horizontal line in each case. (b) Contour plot of the relative error of σr as a function of W0/U0 and σe. The relative error is defined as |σr − σe|/σe. (c) Contour plot of the relative uncertainty of σr as a function of W0/U0 and σe. The relative uncertainty is defined as r.m.s. (σr)|/σe. The data were obtained for S2N = 1 and h0 − h1 = 0.15h0 = 2.5 μ.

