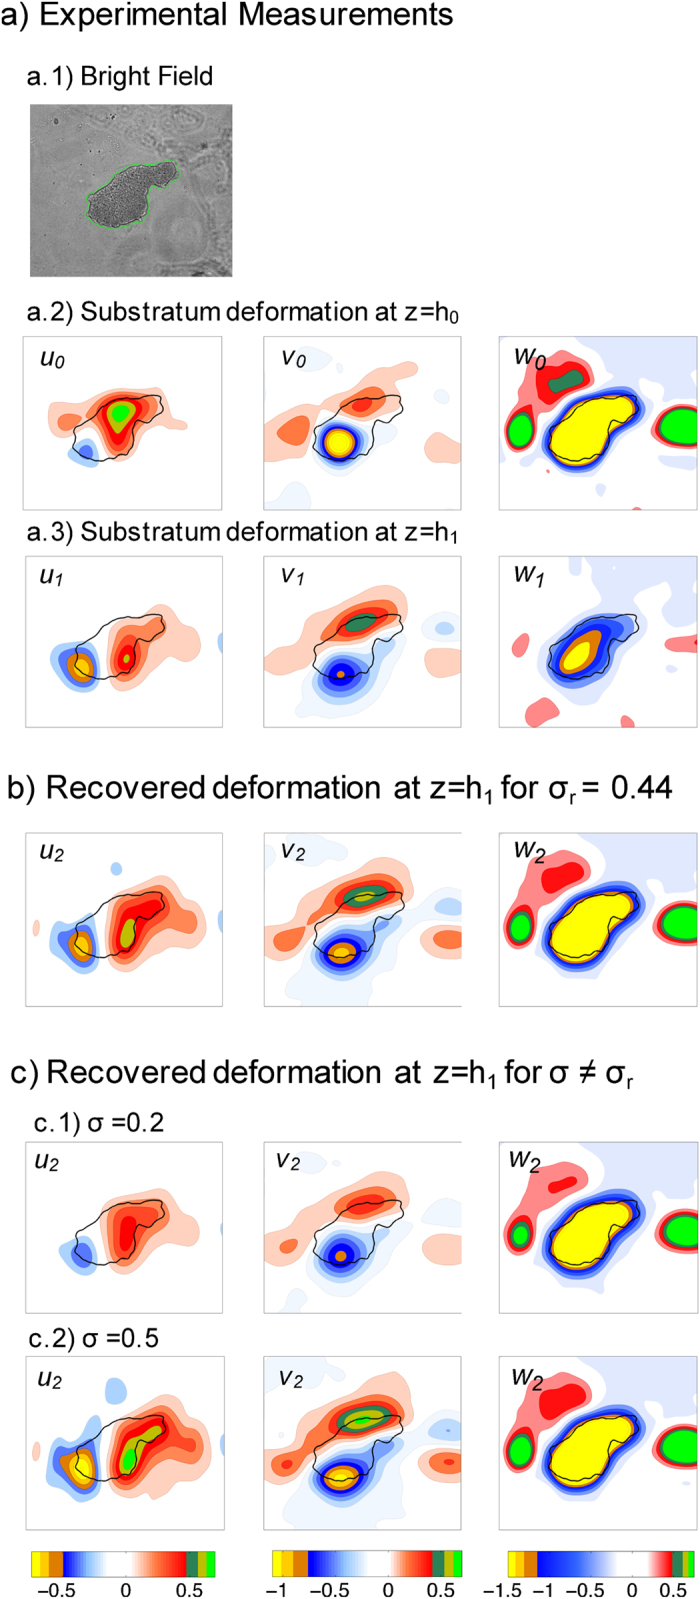
Figure 7. Experimental demonstration of 2LETFM.

(a) Experimental measurements of the deformation applied by a motile Physarum amoebae, (a.1) bright field image of the amoeba with its detected contour plotted in green, (a.2) 3-D substratum deformation generated by the amoeba, u0, measured at the top surface of the substratum (z = h0 ≈ h = 170 μm), (a.3) 3-D substratum deformation generated by the amoeba, u1, measured at a second plane underneath the surface (z = h1 = 154 μm). (b) 3-D deformation u2 at z = h1 calculated from the measured u0 for the value of the Poisson’s ratio recovered by the two-layer approach, σr = 0.44. (c) 3-D deformation u2 at z = h1 calculated from the measured u0 for two values of the Poisson’s ratio below and above σr. (c.1) σ = 0.2. (c.2) σ = 0.5. All the deformations are given in microns according to the colorbars at the bottom of each column.
