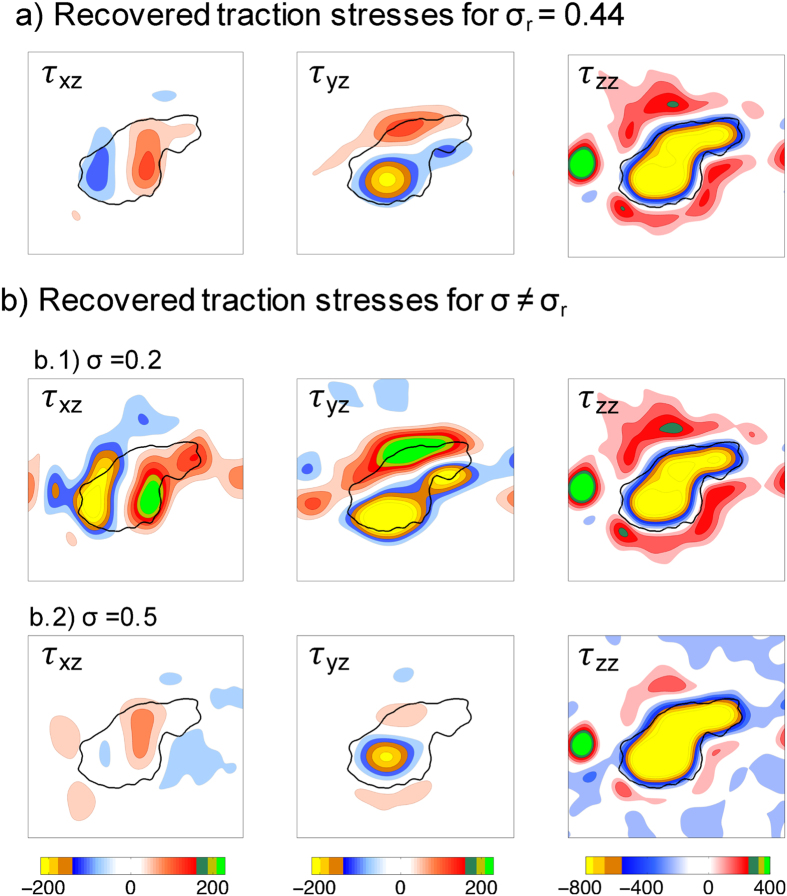
Figure 8. Effect of Poisson’s ratio on the 3-D traction stresses recovered from measured substratum deformation.
The data comes from the same Physarum amoebae shown in Fig. 7. (a) 3-D traction stress vector (τxz, τyz, τzz) obtained using the value of the Poisson’s ratio recovered by the two-layer approach, σr = 0.44. (b) 3-D traction stress vector obtained for σ ≠ σr. The two Poisson’s ratios considered are σ = 0.2 (b.1) and σ = 0.5 (b.2). All the stresses are given in Pascals according to the colorbars at the bottom of each column.

