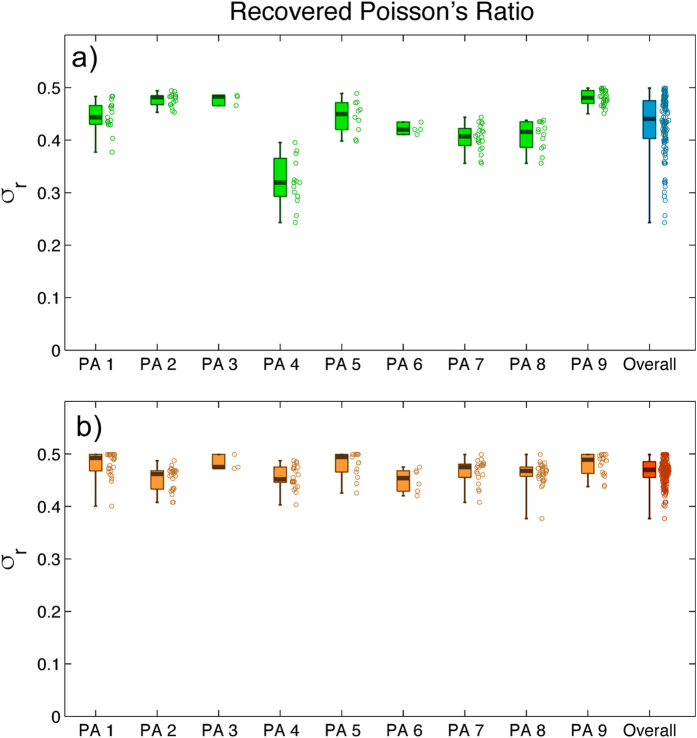
Figure 9. Statistics of Poisson’s ratio values determined in nine different experiments using polyacrylamide (PA) substrata.
The data are presented in the form of boxplots showing the median, the lower and upper quartiles, and the minimum and maximum values of the distribution. The distribution of values for each case is represented scattered to the right of each boxplot. Each data point corresponds to an instantaneous 2LETFM measurement as the cell migrates over the substratum. Each individual substratum is represented by a boxplot, whereas all the data are pooled in the last panel at the right of the graph. The Poisson’s ratios were obtained using the cost functions J1 and J2 (eq. 5) in panels (a) and (b) respectively.

