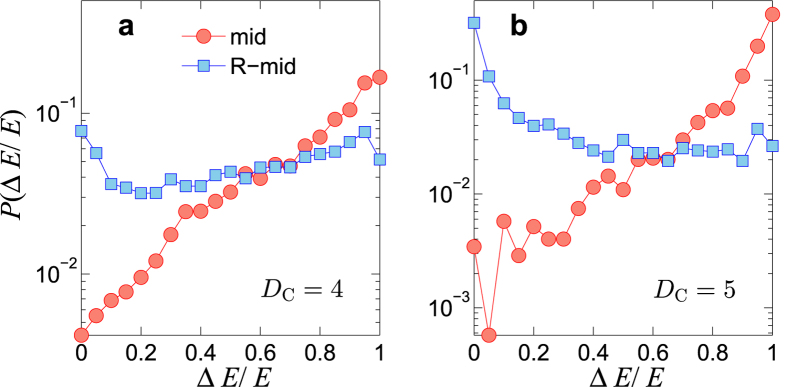
Figure 4. Effects of redundant control inputs.
(a) For control diameter DC = 4, distribution of the normalized energy reduction ΔE/E with redundant control in an ensemble of 10000 ER-random networks (〈k〉 = 6, Pb = 0.1). Results from the LCC-breaking optimization and random control augmentation are marked by “mid” (red circles) and “R-mid”(blue squares), respectively. For each network, a corresponding number of additional random control inputs are applied to the system 10 times to average out the statistical fluctuations. Panel (b) shows the ΔE/E distributions for networks with control diameter DC = 5.

