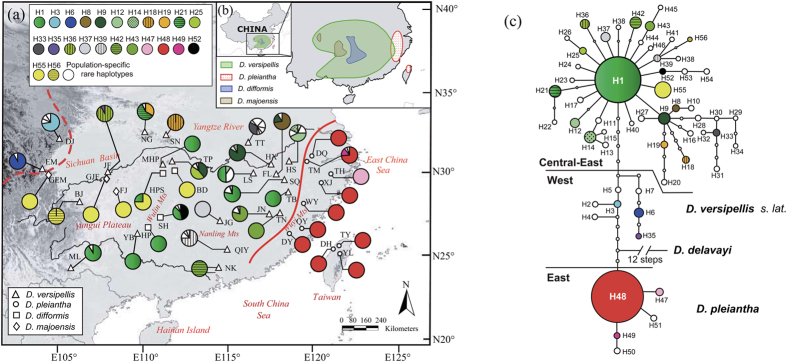
Figure 1.
(a) Geographic distribution of the 56 chloroplast (cp) DNA (trnL‒trnF, trnL‒ndhJ, trnS‒trnfM) haplotypes (H1–H56) detected in the Dysosma versipellis-pleiantha complex, created in illustrator v15.0 (http://www.adobe.com/products/illustrator.html) (see Supplementary Table S2 for population codes). Red dashed and solid lines denote the major western vs. central-east split within D. versipellis s. lat. (i.e. D. versipellis, D. difformis, D. majoensis) and the divergence between the latter and D. pleiantha further east, respectively, as identified by phylogenetic tree and network analyses. (b) Geographic ranges of D. versipellis, D. pleiantha, D. difformis, and D. majoensis18, created in illustrator. The base map was drawn using ArcGis v.9.3 (ESRI, Redlands, CA, USA). (c) Ninety-five percent statistical parsimony network of the 56 cpDNA haplotypes identified in the species complex generated in tsc v1.21 (http://darwin.uvigo.es/software/tcs.html). The small open circles represent missing haplotypes. The size of circles corresponds to the haplotype frequency.

