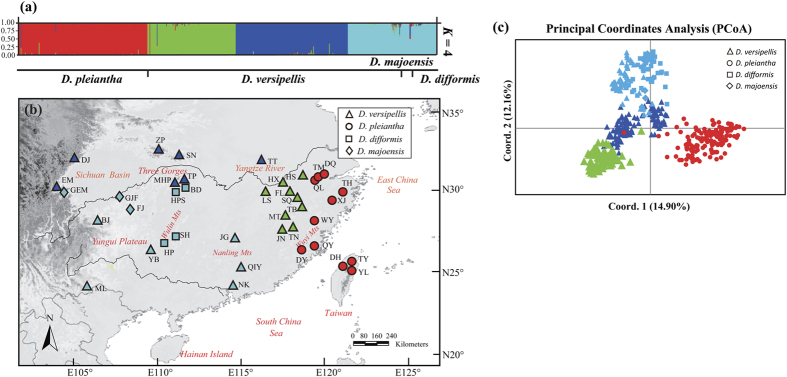
Figure 3.
(a) Histogram of the assignment test for 40 populations (577 individuals) of the Dysosma versipellis-pleiantha complex based on genetic variation at 15 EST-SSR loci using structure v2.3.4 (http://pritchardlab.stanford.edu/structure.html). Each vertical bar represents one individual and its probability of membership for each of the K = 4 clusters. (b) Geographic distribution of the four structure clusters within and among populations of the species complex created in illustrator v15.0 (http://www.adobe.com/products/illustrator.html). The symbol next to each sampling locality identifies the respective Dysosma species, while the filled color represents the cluster assigned to that population (population codes are identified in Supplementary Table S2). The base map was drawn using ArcGis v.9.3 (ESRI, Redlands, CA, USA). (c) Principal coordinates analysis (PCoA) of the 577 individuals from the four species of the complex based on EST-SSR variation (15 loci) using arlequin v3.5 (http://cmpg.unibe.ch/software/arlequin35/).

