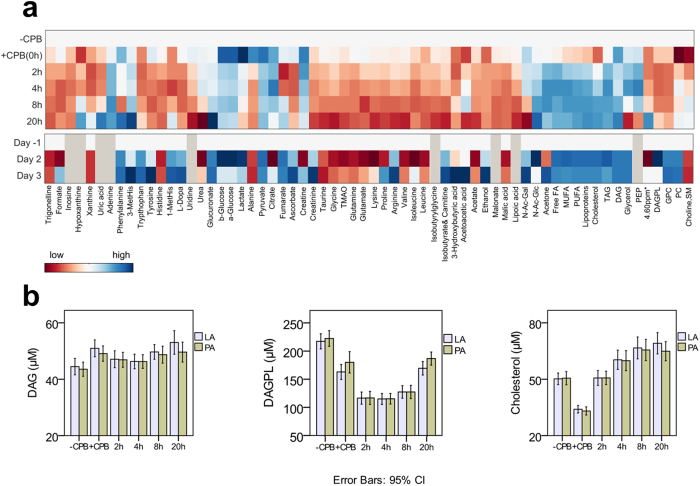
Figure 4. Patients’ metabolic journeys.
(a) Heat map representation of time-dependent metabolic changes occurring within the nine different time points (the day before surgery, ‘Day-1’; before cardiopulmonary bypass, ‘pre-CPB’, immediately after weaning from CPB ‘0 hour’, and 2, 4, 8, 20, 48, and 72 hours post-CPB. The colours are based on the mean changes (in percentages) calculated as (post-CPB − pre-CPB)/pre-CPB*100. Grey colour represents metabolites that could not be detected in plasma samples. (b) Time line for selected metabolites measured in samples collected from the left atrium (LA) and pulmonary artery (PA). Means and standard deviations (error bars represent 95% confidence intervals) are provided. Abbreviations: 1, 3-MetHis., 1- and 3- methylhistidine; TMAO, trimethylamine-N-oxide; N-Ac-Gal, N-acetyl-galactosamine; N-Ac-Glc, N-acetyl-glucosamine; FA, fatty acids; MUFA, monounsaturated fatty acids; PUFA, polyunsaturated fatty acids; DAG, diacylglycerol; PEP, phosphoenolpyruvate; ppm, parts per million; 4.60 ppm*, unassigned metabolite; DAGPL, diacylglycerophosphocholine; PC, phosphatidylcholine; GPC, glycerophosphocholine; SM, sphingomyelin.

