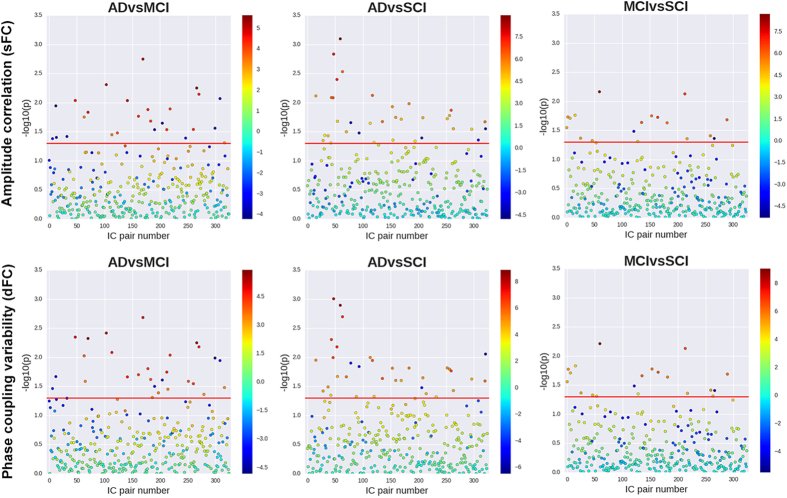
Figure 2. Logistic regression results for sFC and dFC at the 325 IC pairs.
The results represent raw p-values were obtained from logistic regression models adjusting by gender, age, in-scanner motion and headcoil. The horizontal red line indicates the p-value threshold (0.05) in the corresponding logarithmic scale. Colorbars display regression coefficients for the different pairs.

