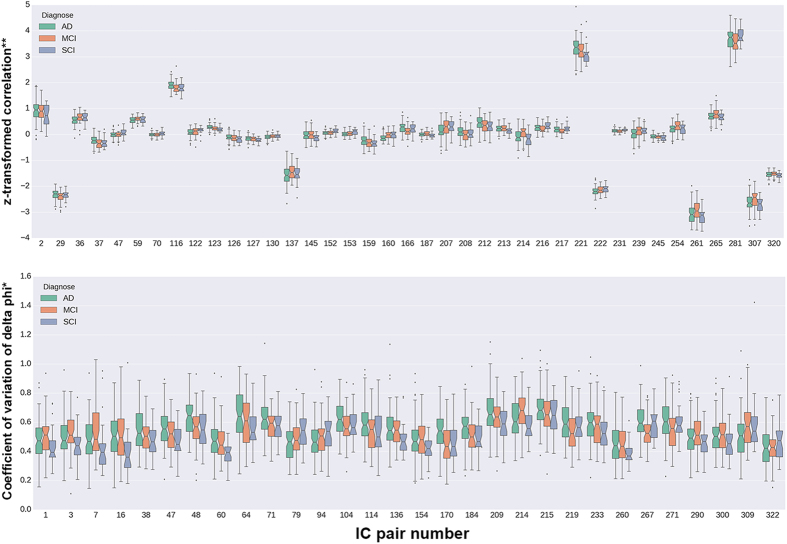
Figure 4. Raw sFC and dFC values at the IC pairs with significance from the NBS tests.
The trends shown here corresponds to the direct measures of pairwise coupling (see Methods), whereas the test results discussed in the text show that the association between diagnostic status and dFC persists even after adjustments for gender, age, and headcoil. Notes: *coefficient of variation (standard deviation divided by mean) of the normalized phase differences (see Methods); **z-transformed value of the regularized regression coefficients.

