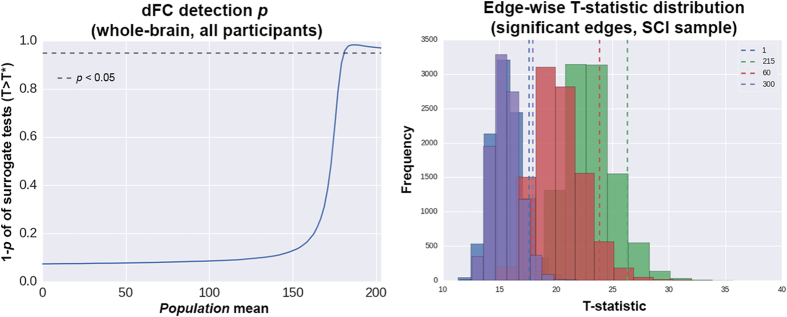
Figure 5. Surrogate data test results at the whole-brain level and at edges with group differences.
Left: test of the sampled dFC values (sum of 325 edge weights) against a range of population means. Right: analysis of the dFC empirical values against their surrogate null distributions in the SCI group. The plot shows only the four edges with both statistically significant (clinical) group differences and p < 0.1 in the surrogate tests. Numbers next to the dashed line legends correspond to IC pairs. Additional details on the test procedures are described in Results.

