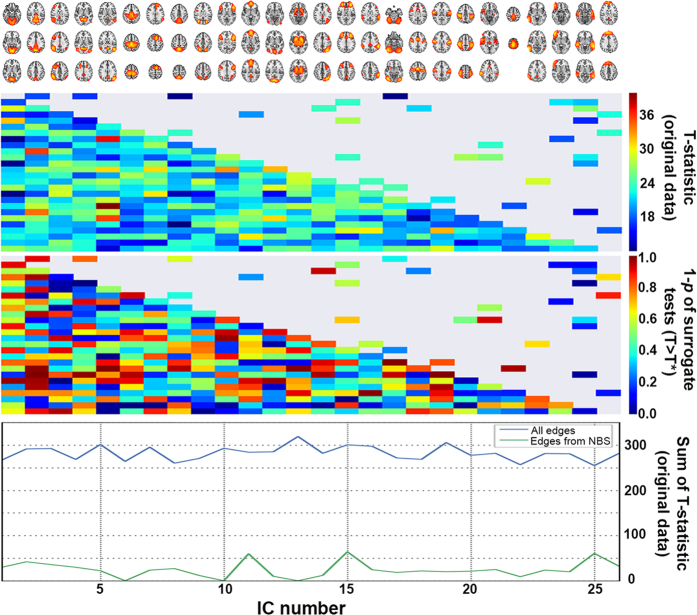
Figure 6. Results of surrogate data tests for dFC in the SCI group.
Uppermost heatmap: T statistic maps from one-group T-tests (null hypothesis: dFC population mean = 0 at every edge). Only the original data was used for that plot. The upper diagonal shows only connections with statistically significant differences depending on clinical diagnose. Lowermost heatmap: using 10000 surrogate datasets, T* values were estimated, and 1 minus the proportion of times with T (original) > T* (surrogate) was considered the p-value for the presence of true dynamics. Note that the colormap corresponds to 1-p (lower p-values have warmer colors). In both heatmaps, the upper diagonal shows only connections with statistically significant differences depending on clinical diagnose. Bottom: sum of (empirical) T-statistic for each IC.

