
Fig. 1.
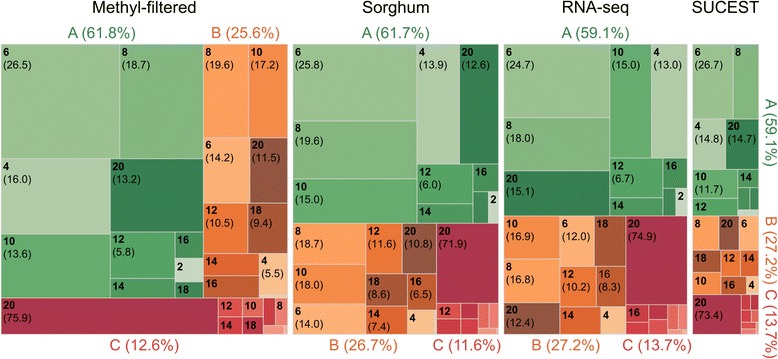
Mosaic plot showing the ploidy levels that produced the highest posterior probabilities for the mapping of GBS sugarcane population data considering the following four pseudo-references: the methyl-filtered sugarcane genome, Sorghum bicolor genome, RNA-seq sugarcane transcriptome and sequences from the SUCEST project. The areas of the rectangles are proportional to the number of loci that have the same ploidy level, as indicated within each rectangle in parentheses. According to the posterior probabilities calculated for each even-numbered ploidy level within a range from 2 to 20, each locus was classified into one category using the following ad hoc criteria: Category A (green), when the highest posterior probability was greater than or equal to 0.80; Category B (yellow), when no single value of the posterior probability was higher than 0.80 but the sum of the two highest ones was greater than or equal to 0.80; and Category C (red), which included all other cases. In parentheses: the number of loci as a percentage within the given ploidy level and category