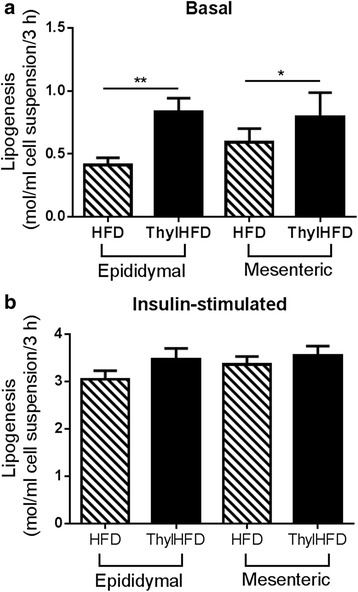
Fig. 4.

a-b Lipogenesis in the basal (non-stimulated) a and insulin-stimulated (28 nM) b states in epididymal and mesenteric adipocytes from mice fed HFD vs ThylHFD for two weeks. Bars represent median and interquartile range. Statistical difference of p < 0.05 was considered significant (*p < 0.05, **p < 0.01)
