
Fig. 2.
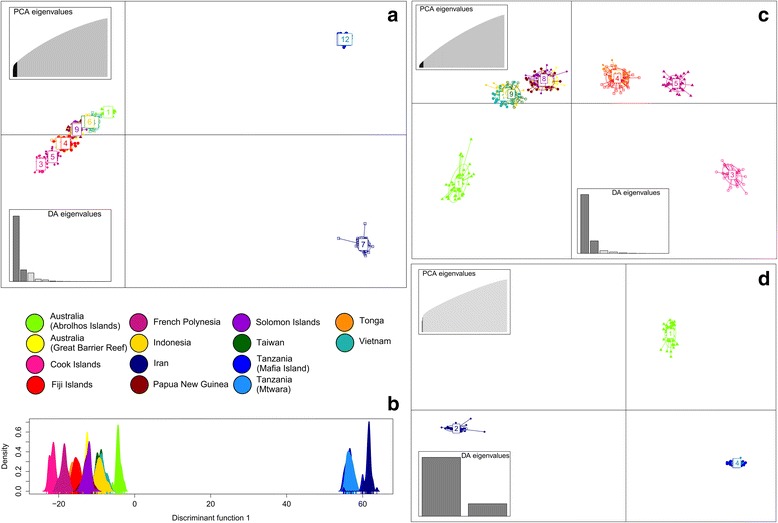
Discriminant Analyses of Principal Components (DAPC) carried out using the R package adegenet to illustrate broad-scale patterns of population structure. Dots on scatterplots represent individuals, with colours denoting sampling origin and inclusion of 95% inertia ellipses. Scatterplot (a) was constructed among all 580 individuals collected from both the Pacific and Indian Ocean sites, while (b) is an individual density plot on the first discriminant function for this dataset. Scatterplots (c) and (d) were constructed on individuals sampled from Pacific Ocean (c) and Indian Ocean (d) sites only, to clearly identify regional differentiation