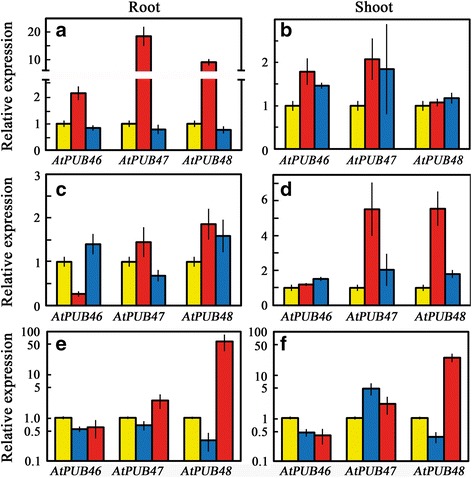
Fig. 4.

Expression levels of AtPUB46-AtPUB48 genes in response to abiotic stress analyzed by RT-qPCR. Ten day old seedlings were exposed to the following treatments: (a, b) salt- and osmotic stress: control (yellow); 0.2 M NaCl (red); 0.4 M mannitol (blue) for 6 h. c & d, oxidative stress: control (yellow); 100 mM H2O2 (red); 1 μM methyl viologen (blue) for 3 h in the light. e, f temperature stress: 25 °C (yellow); 3 h at 4 °C (blue); 15 min at 45 °C (red). Data shown are average ± SE
