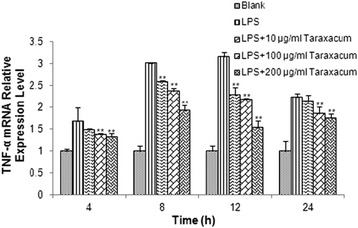
Fig. 2.

Expression of TNF-α mRNA in RMMVECs upon 1 μg/mL LPS stimulation in presence or absence of dandelion at different time point. 1 μg/mL LPS solution was used to stimulate RMMVECs and dandelion with 10, 100 and 200 μg/mL were added to RMMVECs at 4 h post LPS-stimulation. Quantitative real-time PCR was used to analyze the TNF-α mRNA expression at 4, 8, 12 and 24 h post-dandelion treatment. The relative expression of TNF-α were shown by normalizing the mRNA level of TNF-α to that of a housekeeping gene β-actin. Data are expressed as means ± SEM (n = 3 in each group). * p < 0.05 or ** p < 0.01 vs. LPS stimulating group at the same time point
