
Fig. 1.
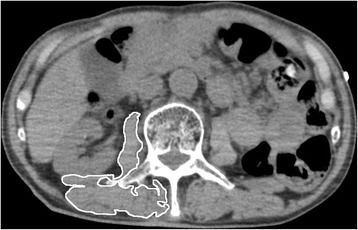
CT image at the L3-sectional muscle. The right L3-sectional muscle area is outlined. Muscle area and mean muscle attenuation are calculated by the picture archiving and communication system (PACS) software
Official websites use .gov
A
.gov website belongs to an official
government organization in the United States.
Secure .gov websites use HTTPS
A lock (
) or https:// means you've safely
connected to the .gov website. Share sensitive
information only on official, secure websites.
CT image at the L3-sectional muscle. The right L3-sectional muscle area is outlined. Muscle area and mean muscle attenuation are calculated by the picture archiving and communication system (PACS) software