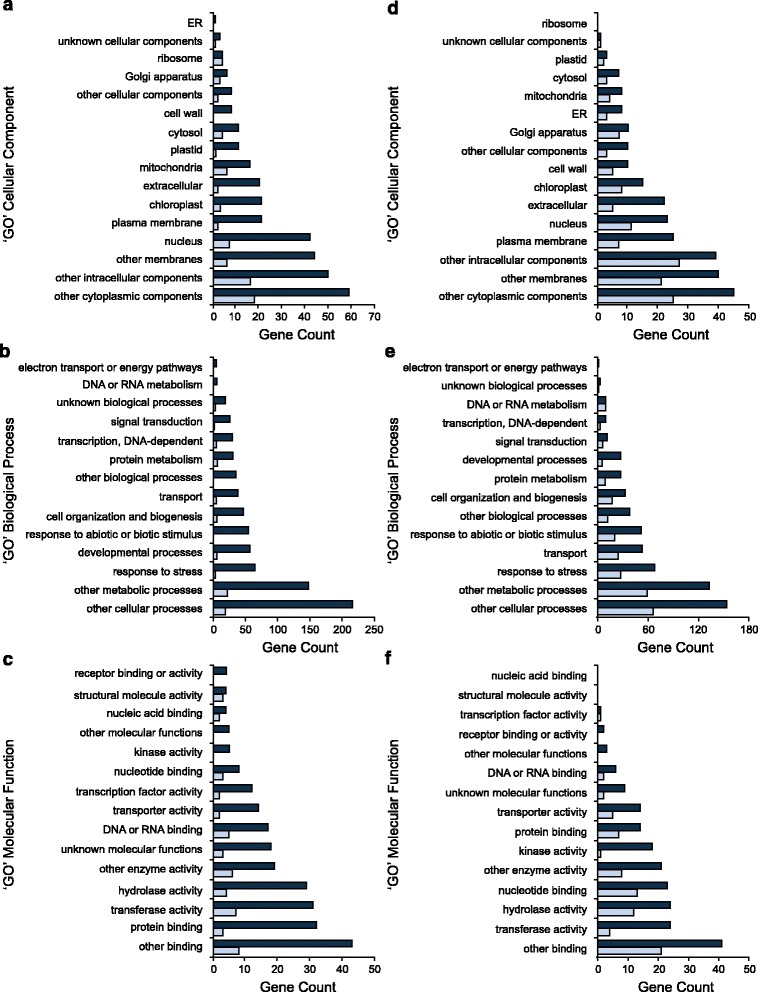
Fig. 4.

Gene product annotations of upregulated and downregulated genes in high root isoflavonoid cultivars. a, d cellular compartment; b, e biological processes; c, f molecular function annotation, using the Gene Ontology Database annotations of TAIR identifiers that are homologous to differentially expressed soybean genes. a-c are upregulated and d-f downregulated genes in high root isoflavonoid cultivars. Dark blue and light blue bars denote differentially expressed genes at a p-value of <0.05 and <0.001, respectively
