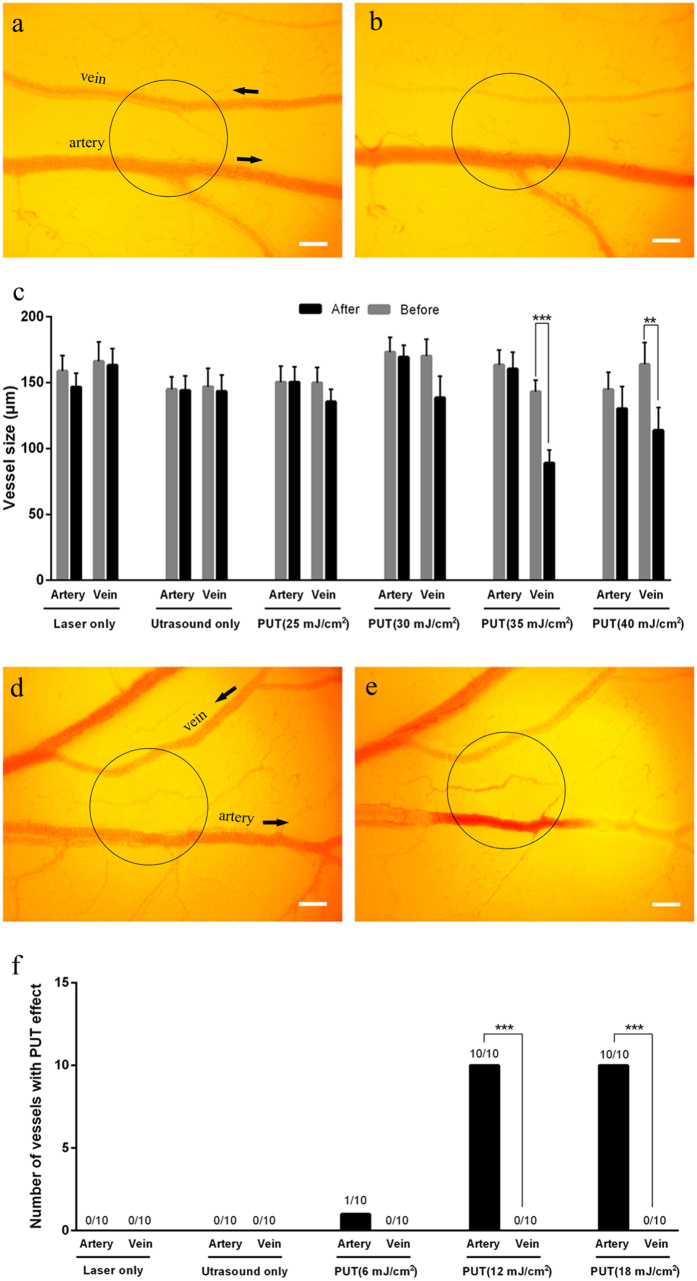
Figure 3. Selective treatment of veins or arteries on chicken yolk sac membranes using PUT.
(a,b) The photographs of a pair of artery and vein before and after a treatment, respectively. PUT was performed with 0.25 MPa ultrasound negative peak pressure and 35 mJ/cm2 laser fluence at 578 nm. (c) Changes in the vessel diameters after different treatments. The changes of the vessel size were only statistically significant in the veins of the PUT groups with 35 mJ/cm2 and 40 mJ/cm2 laser fluence (n = 10 for each group). Vertical bars indicate standard deviation. The laser wavelengths in (c) were all at 578 nm. (d,e) The photographs of a vein/artery pair before and after a treatment, respectively. The PUT treatment was performed with 0.45 MPa ultrasound negative peak pressure and 12 mJ/cm2 laser fluence at 650 nm. (f) The number of veins and arteries that responded to each treatment (n = 10 for each group). Response to treatment was defined as either rupture or occlusion of a blood vessel. The laser wavelengths in (f) were all at 650 nm. The treated area is circled and black arrows indicate the orientation of blood flow. **p < 0.01; ***p < 0.001. Scale bar: 200 μm.

