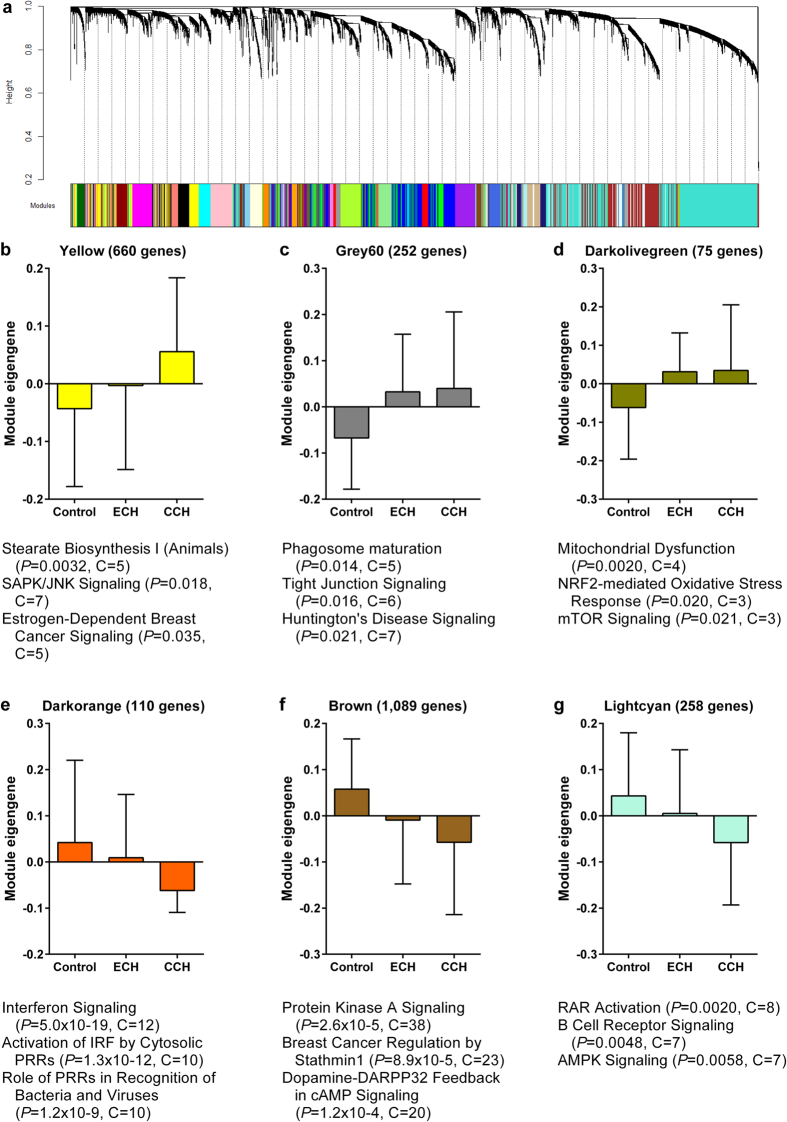
Figure 2. Gene co-expression modules in whole blood associated with cluster headache.
Detection of co-expression modules in RNA-seq data of whole blood samples of cluster headache patients and controls using weighted gene co-expression network analysis (WGCNA). (a) The cluster dendrogram that gave rise to 40 modules, indicated by different colours. (b–g) Bar graphs of the module eigengenes in controls, episodic (ECH) and chronic cluster headache (CCH) of the six modules associated with cluster headache. The module eigengene can be considered the optimal summary of the module-specific gene expression pattern. Top three pathways significantly overrepresented in each module are listed below each bar graph. P = P-value, C = count of genes in the module belonging to the pathway.

