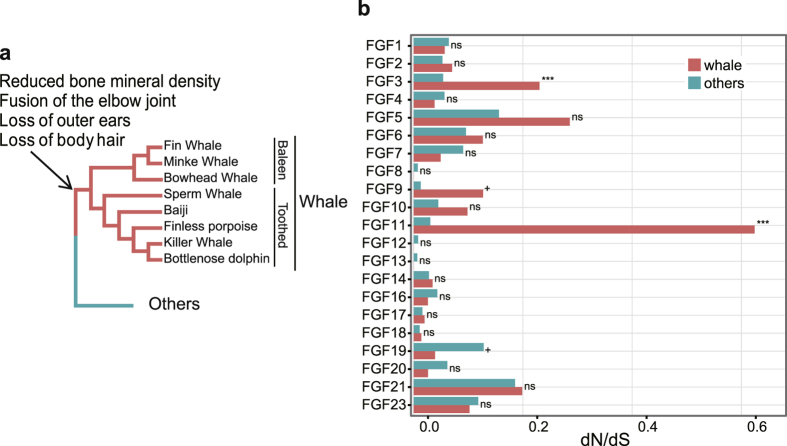
Figure 2. Evolutionary analysis of FGF genes.
(a) The species tree was drawn based on previous studies53,54,55,56. (b) The dN/dS ratio of whale branches (orange) and the other mammalian branches (turquoise) for each FGF gene. The ns, +, and *** denotes the significance level with p > 0.1, p < 0.1, and p < 0.001, respectively.

