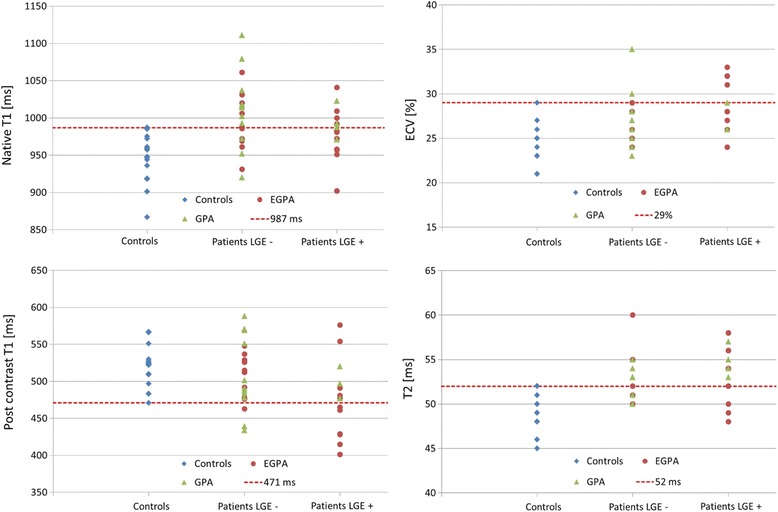
Fig. 4.

Values for T1 (native, post-contrast), ECV, and T2 in controls, LGE-negative and LGE-positive EGPA (represented by circles), and GPA (represented by triangles) patients. The dotted lines represent the thresholds for values beyond the 95% percentile of the control group (definite abnormal values)
