Fig. 2.

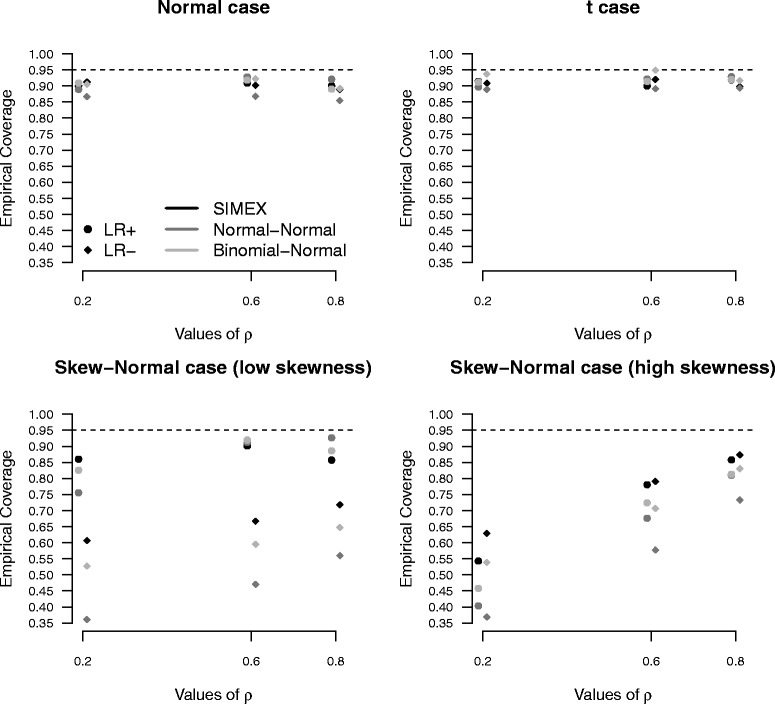
Positive and negative likelihood ratio results. Empirical coverages of confidence intervals for positive and negative likelihood ratio under increasing values of ρ, on the basis of 1, 000 replicates for the high accuracy scenario, with n=10

Positive and negative likelihood ratio results. Empirical coverages of confidence intervals for positive and negative likelihood ratio under increasing values of ρ, on the basis of 1, 000 replicates for the high accuracy scenario, with n=10