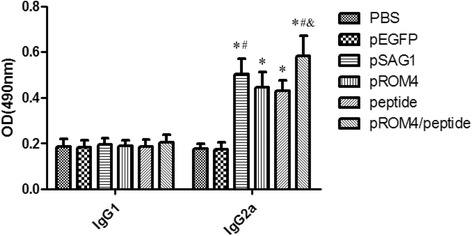
Fig. 3.

Detection of IgG1 and IgG2a levels in immunized mice sera by ELISA. Sera was collected at 2 weeks after the last injection and detected by ELISA. All samples were performed four times. The results are mean of 27 mice per group and expressed as the mean of the optical density of 490 ± SD. * P < 0.05, as compared with PBS and pEGFP-C1; # P < 0.05, as compared with ROM4 or peptide; & P < 0.05, as compared with pSAG1
