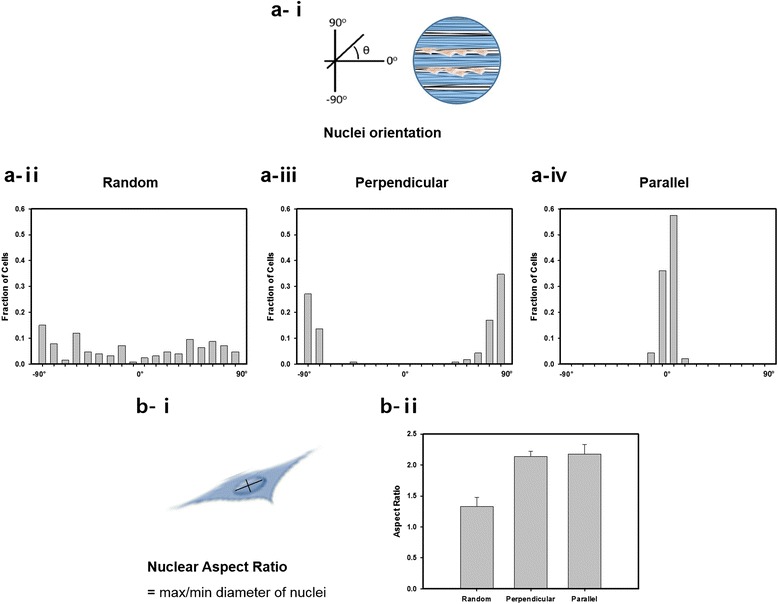
Fig. 4.

Cell alignment and elongation on scaffolds. a Cell alignment was measured by the angle between the long axis of cells and the direction of the micropattern (i); the histograms of the relative alignment in ± 10° increments demonstrate the cellular alignment on the aligned nanofiber (ii-iv). b Cell elongation was estimated by the aspect ratio (max/min diameter of nuclei) (i), and the statistical analysis demonstrates that the aspect ratios significantly decreased on the random fibrous scaffolds compared with aligned fibrous scaffolds (ii)
