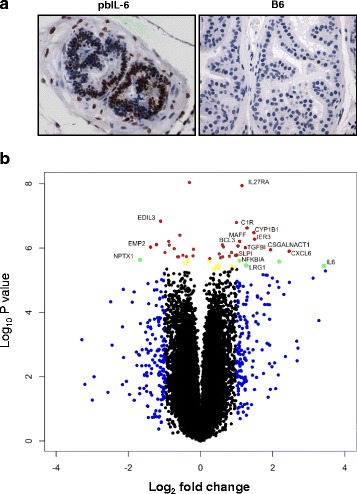
Fig. 4.

IL-6 activates STAT3 pathway and reprograms prostate gene expression to be pro-tumorigenic. a IHC demonstrating phosphorylation of STAT3 in the prostate epithelium and stromal components in pbIL-6 mice, whereas pSTAT3 was rarely detected in prostate from the B6 WT littermates. b A volcano plot demonstrating upregulation of genes associated with oncogenic and inflammation in the prostate of pbIL-6 mice. The log2 fold change of genes between four samples of IL6 mice vs. two WT littermates is plotted against the negative log10 p value in the volcano plot. The brown and red dots are above bonferroni adjusted p values for 22,623 tests for alpha 0.05. The yellow and green dots are genes above an alpha of 0.1 and below 0.05. The red, green and blue dots are genes with average fold greater than 1 for the log2 ratio. The green and red are above the log2 ratio of 1 and are significant at the 0.1 or 0.05 alpha level, respectively. The function of the most upregulated genes are indicated in Additional file 1: Table S1-4
