
Figure 3.
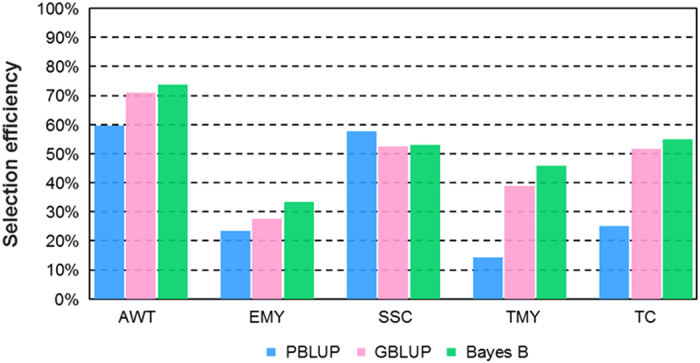
Selection efficiency based on genetic gains when selecting the top 10% of genotypes (corresponding to 30 individuals) for three different GS models fitted with T2/2013 phenotypic and marker data for training and used to make predictions in T2/2014 using T2/2014 marker data only. Gains are compared with breeding values for T2/2014 estimated using both phenotypic and marker data from T2/2014. AWT, average weight (g per fruit); EMY, early marketable yield (g per plant); SSC, soluble solids content (%); TC, proportion of total culls (%); TMY, total marketable yield (g per plant).