


. 2016 Dec;20(12):689–694. doi: 10.4103/0972-5229.195701
Copyright: © Indian Journal of Critical Care Medicine
This is an open access article distributed under the terms of the Creative Commons Attribution-NonCommercial-ShareAlike 3.0 License, which allows others to remix, tweak, and build upon the work non-commercially, as long as the author is credited and the new creations are licensed under the identical terms.
Figure 2.
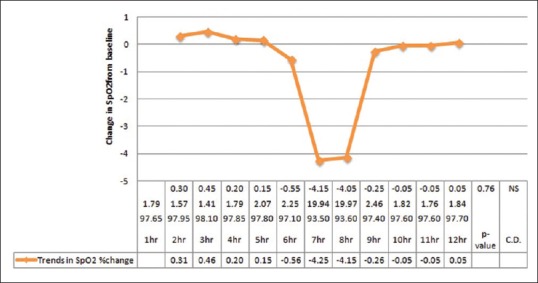
Trends in SpO2 change during study period