
Figure 1.
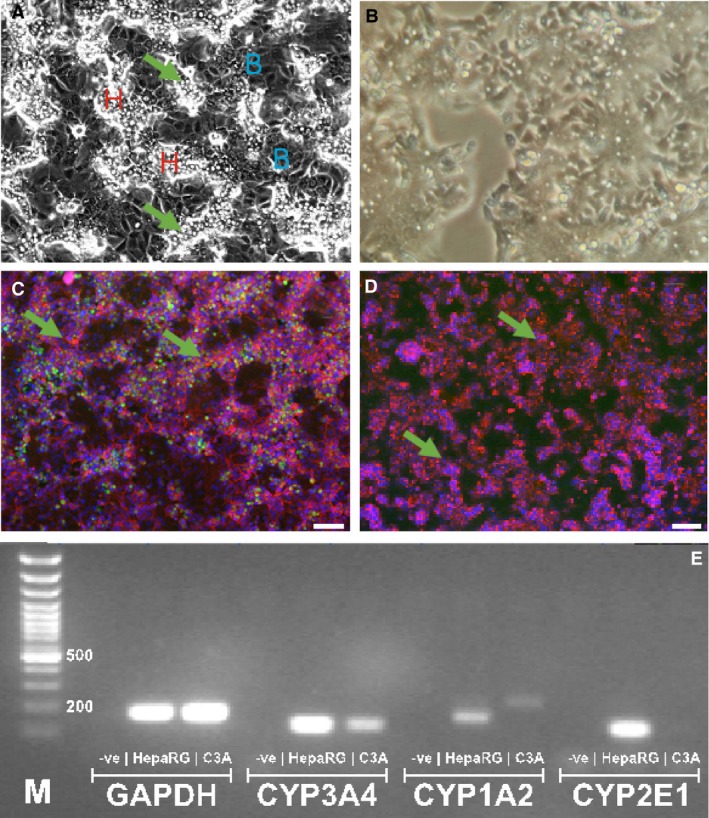
Phenotypic profiling of human hepatic HepaRG compared with C3A cells HepaRG cells are an intrinsic co‐culture of hepatocyte‐ and cholangiocyte (biliary)‐like cells (denoted B, in panel A) with islands of hepatocytes (H) with sharp refractile borders/round nuclei, and bile canaliculi (arrows) interspersed with a thin layer of cholangiocytes (panel A). C3As form a confluent monolayer of hepatocyte‐like cells, with less prominent bile canaliculi/refractile borders (B). (C) HepaRG cells exhibit a highly differentiated phenotype (culture day 8): tri‐colour fluorescent staining revealed extensive hepatic CYP3A4 enzyme activity (green); punctate staining of F‐actin bands, indicative of bile canalicular structures [red phalloidin staining, green arrows], with in vivo‐like hepatic cords and cholangiocyte‐like cell ‘voids’. In contrast, in C3A cells CYP3A4 enzyme activity is undetected (D), with low CYP450 gene expression/metabolic competence in comparison with high CYP2E1, CYP1A2 and CYP3A4 gene expression in HepaRG cells, after end‐point PCR (E).