
Figure 3.
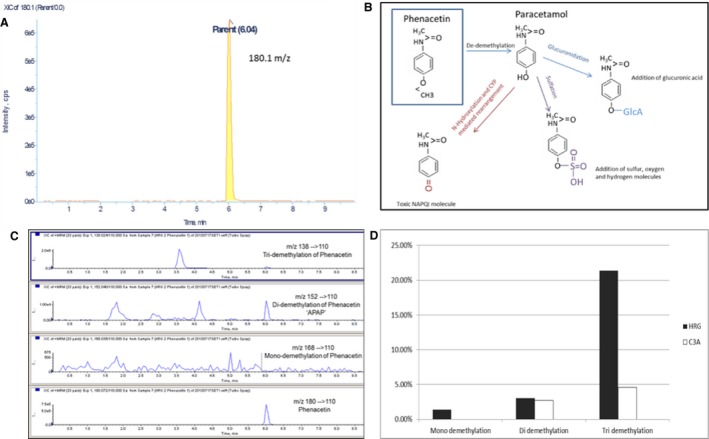
Representative chromatograph extracted from Light Sight software: Peak of parent compound phenacetin at its unique 180.0 m/z ratio (A). Schematic diagram showing Phase I and Phase II metabolism of phenacetin: Phase I (de‐demethylation) of phenacetin to paracetamol (acetaminophen), and Phase II secondary metabolites of acetaminophen via the processes of glucuronidation, sulphonation and N‐hydroxylation (B). LC‐MS chromatograms: Representative chromatograms of mono‐, di‐ and tri‐demethylation of HepaRG cells after challenge with phenacetin. The parent compound phenacetin is shown at 180 m/z, mono‐demethylation shown at 168 m/z, di‐demethylation 152 m/z and tri‐demethylation 138 m/z (C). (D) Comparison of mean % turnover of demethylation (comparing mean % of mono‐, di‐ and tri‐demethylation) between HepaRG and C3A cells.