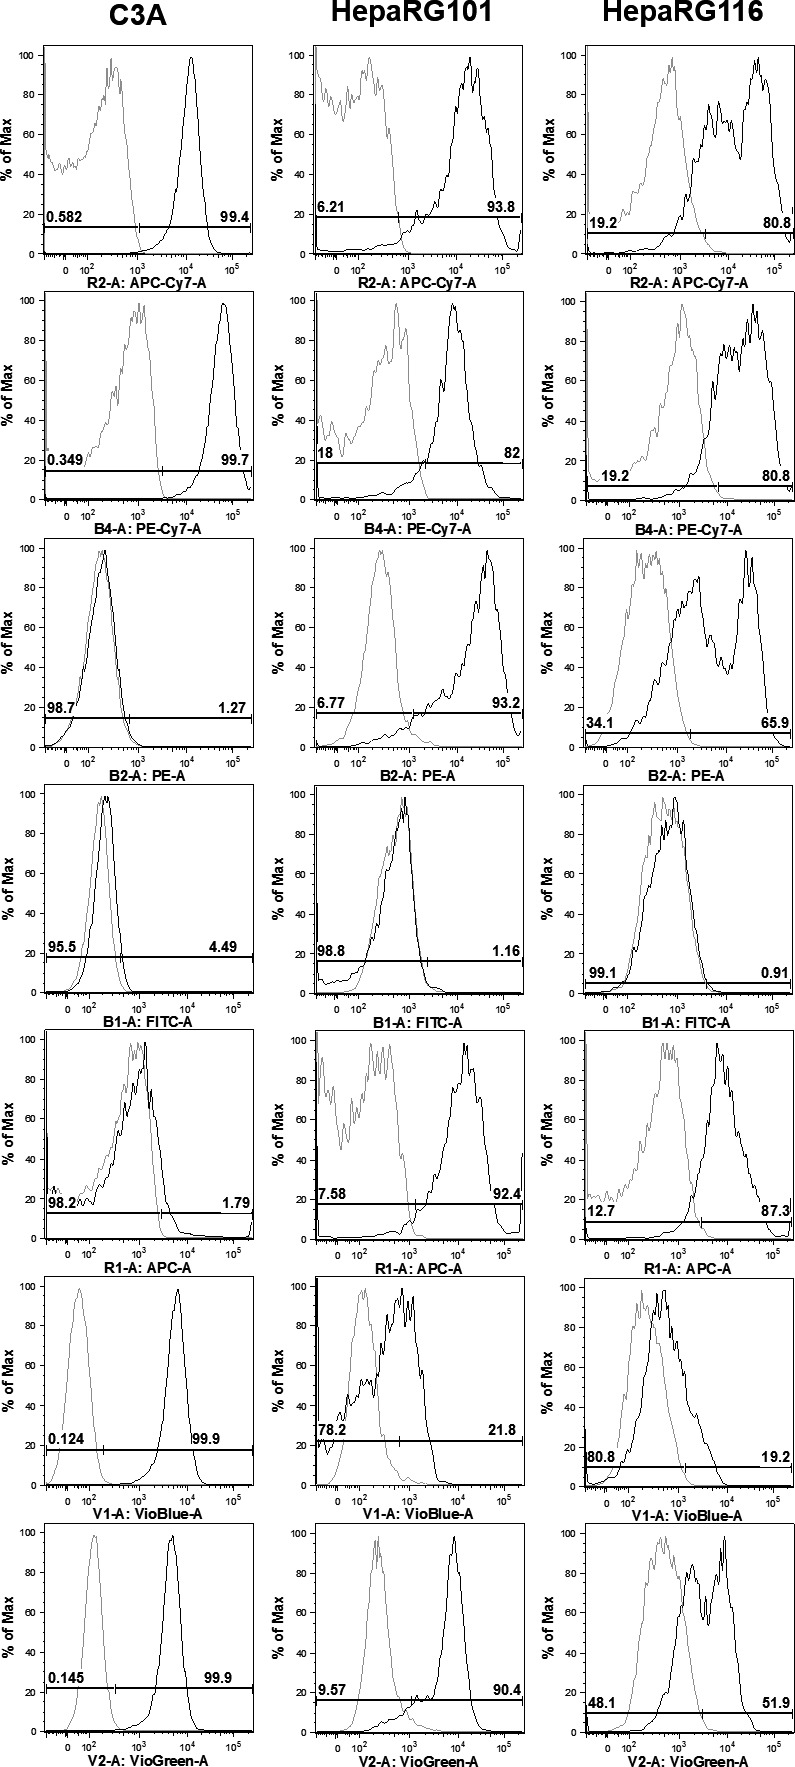
Figure 5.

Flow cytometry profiling of integrin expression in HepaRG and C3A cells. Flow cytometry histograms comparing integrin expression (CD49a‐f: α1–α6) and CD29 (integrin β1) between C3A, HepaRG101 and HepaRG116 cell lines (dark lines), and isotype controls (grey lines). CD49d was not expressed by any of the three lines. The expression of CD49a, CD49b and CD29 was comparable between all 3 cell lines, although a proportion of HepaRG116 cells had down‐regulated expression. Whereas the expression of CD49e by HepaRG101 cells was maintained on HepaRG116 cells, but absent from C3A cells. This was also true for the expression of CD49c, except that there was some down‐regulation of expression by HepaRG116 cells. Conversely, C3A expressed CD49f, whilst it was absent or low on HepaRG101 and 116 cells.
