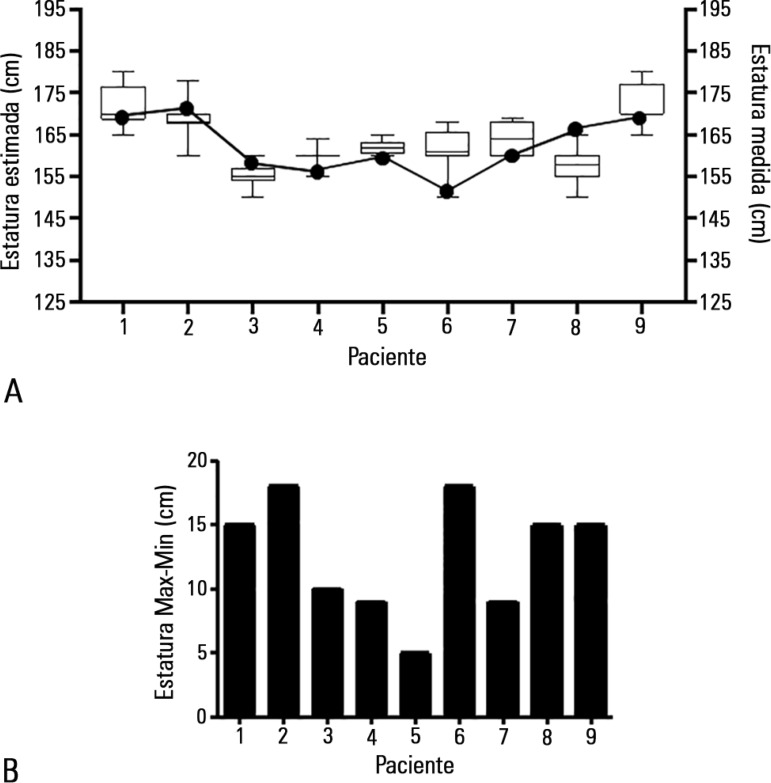
Figure 3.
Height assessment by visual evaluation. The evaluation of nine patients by eleven observers. Box plots represent the distribution of height estimations by visual assessment, and white dots represent height determination by knee measurements (A). Graphic bars indicate the range between maximal and minimal determinations on each patient (B).

