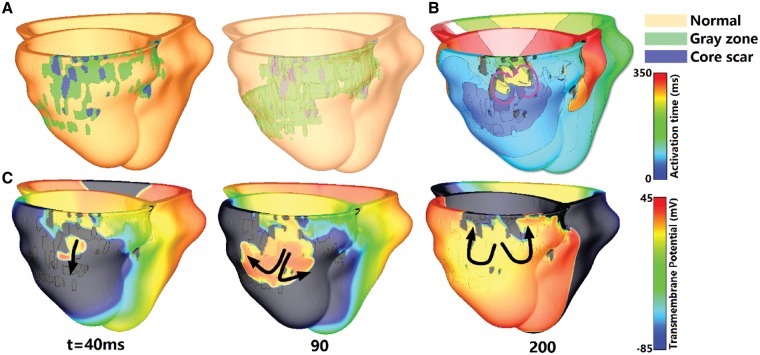
Figure 2.
Geometrical models, which include normal tissue, grey zone, and core scar are presented (A) together with electrical activation isochronal maps (B), with purple arrows representing the direction of propagation of the reentrant arrhythmia. Transmembrane potential maps show the initiation of VT in Patient 1 model (C). Black arrows show direction of propagation. The time instant below each map is counted from the delivery of the last pacing stimulus.

