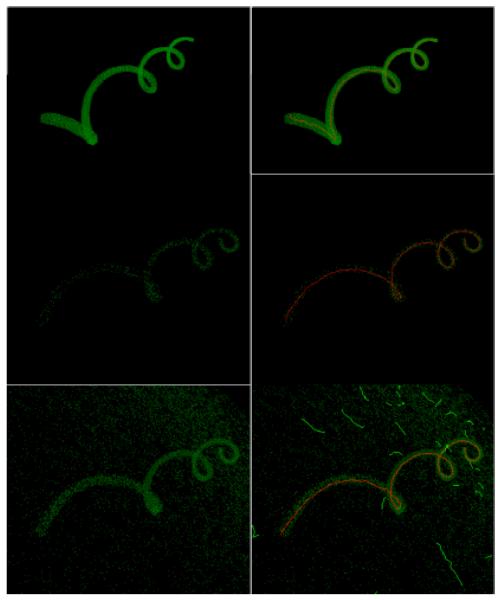
Figure 4.
Synthetic helix at different levels of noise and porosity (left column), and the results produced by our approach (right column). Top row: n=0%, p=0%; middle row: n=0%, p=95%; bottom row: n=2%, p=75%. In summary, our approach performs well in a range of scenarios, properly detecting the helix at high porosity and noise levels. However, when noise reaches an extreme limit, spurious filaments begin to form. See Table 1 for reports of the quantitative results.

